Dashboard Agents: What Business Professionals Must Learn Before AI Starts Explaining the Numbers
By Melverick Ng | Published | Updated | 8 min read
The next AI skill gap is not prompt writing.
It is knowing how to turn numbers into decisions that can be checked, approved, and repeated.
Google Cloud announced Looker agents on 11 June 2026, positioning business intelligence around interactive data experiences rather than static dashboards. In the same week, Google Cloud also discussed the Open Knowledge Format for data sharing and the next era of Confidential AI.
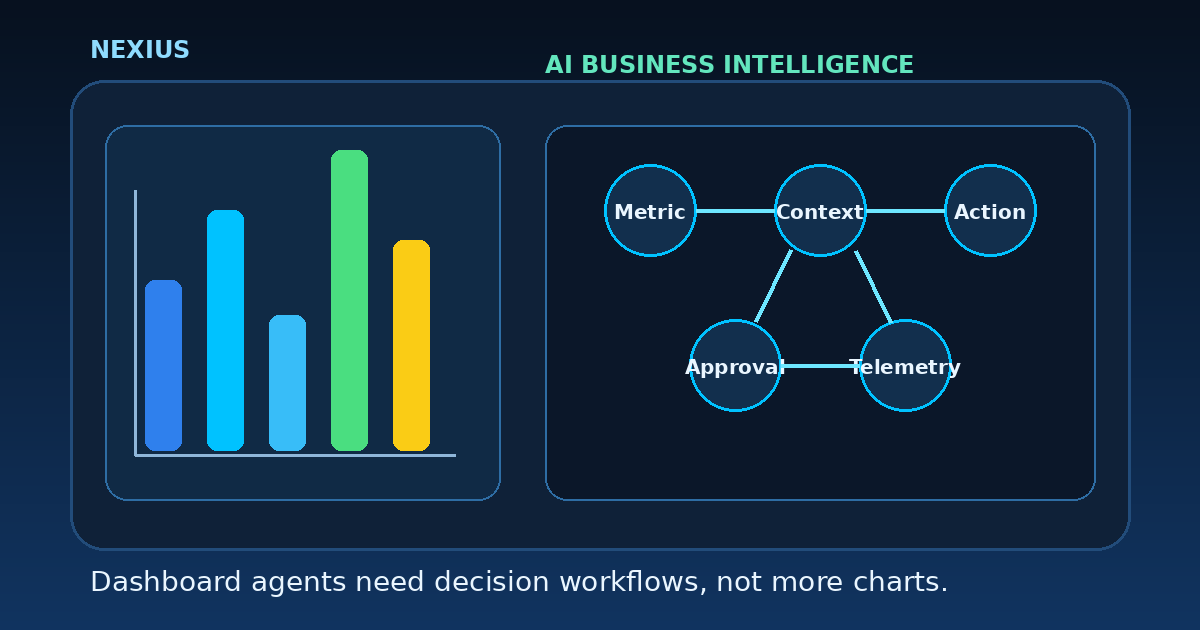
The signal is practical: AI is moving closer to the business reporting layer. It will not just show charts. It will explain changes, ask follow-up questions, surface exceptions, and help teams prepare the next action.
For non-technical professionals, that changes what “data literacy” means.
Trend Basis
On 11 June 2026, Google Cloud introduced dashboard agents in Looker for interactive data experiences. On 12 June 2026, it introduced the Open Knowledge Format as a way to improve data sharing. Google Cloud also published on Confidential AI for protected AI workloads. Together, these announcements point to a clear operator trend: analytics is moving from passive reporting into AI-assisted decision workflows, and governance must move with it.
1.What Is a Dashboard Agent?
A dashboard agent is AI connected to business metrics, charts, and data models. Instead of asking a human to stare at a dashboard, the agent can help explain what changed and where to look next.
In a real company, that may mean helping with:
- Explaining why sales pipeline dropped this week.
- Flagging unusual margin movement by customer segment.
- Comparing actual spend against budget and forecast.
- Preparing a weekly management summary from trusted metrics.
- Turning dashboard exceptions into tasks for the right owner.
- Checking whether a decision has enough data behind it.
The value is not the chat interface. The value is whether the agent can work from trusted definitions and help the team make better decisions faster.
Next Step
Download the SME Workflow Checklist
Get the exact checklist we use to spot high-ROI automation opportunities in under 15 minutes.
2.Why Business Professionals Cannot Leave This to IT
IT can connect systems. Data teams can model tables. But the people closest to the business must define what good judgement looks like.
Before a dashboard agent can be useful, someone must define:
- Which metric is the source of truth.
- What threshold counts as a real exception.
- Which comparison period is fair.
- Who owns each action after an insight appears.
- Which recommendations need manager approval.
- What must be logged for audit and learning.
This is where domain experts become AI architects. They translate messy business judgement into workflows an agent can support.
3.The Skill Shift: From Reading Dashboards to Designing Decision Workflows
A normal dashboard answers: what happened? A useful AI-enabled dashboard workflow asks: what changed, why does it matter, who should act, and how do we know the action worked?
Metric definition
Professionals must be able to define revenue, pipeline, conversion, utilisation, churn, ageing, margin, and service levels clearly. If the metric definition is loose, the AI explanation will be loose.
Exception design
Decide what counts as normal noise versus a real exception. An agent should not interrupt the team for every small movement. It should know which changes deserve attention.
Action design
Insights are not outcomes. The workflow should define the next action, owner, due date, approval gate, and review metric. Otherwise AI just creates smarter commentary.
Next Step
Check Your SkillsFuture Subsidy
See your estimated net payable fee and eligibility path in under 60 seconds.
Check My SubsidyRelated Course Module
Module: Build Your First Agentic Workflow Blueprint
Learn how to map, automate, and test one real workflow from your own business during class.
See module details4.The Risk: Confident Answers on Weak Data
Dashboard agents make data feel more conversational. That is useful, but it also makes weak data sound more convincing.
Professionals need to check the foundations:
- Data lineage: where the number came from.
- Access control: who can see sensitive metrics.
- Context boundaries: which tables and definitions the agent can use.
- Approval controls: which recommendations are advisory only.
- Telemetry: what the agent answered, which data it used, and what humans did next.
Governance is not about slowing analytics down. It is how teams trust AI-generated insights enough to act on them.
5.What to Practise in Training
A useful AI course should help professionals practise decision design, not just tool navigation.
- Choose one reporting workflow from your role.
- Define the source-of-truth metrics and business rules.
- Identify common exceptions and false alarms.
- Write the agent instructions for explaining changes.
- Design approval gates for sensitive recommendations.
- Measure whether the workflow reduced rework, delay, or missed follow-up.
That is the difference between reading a dashboard and operating with one.
Final Thought
Dashboard agents will make analytics easier to talk to. But easy answers are not the same as good decisions.
The professionals who win will be the ones who can connect metrics, workflows, approvals, and outcomes.
Orchestrate the decision. Do not just read the chart.
Sources
- Google Cloud: Transform dashboards into interactive data experiences with Looker agents
- Google Cloud: Introducing the Open Knowledge Format
- Google Cloud: Powering the next era of Confidential AI
About the Trainer
Melverick Ng is Founder of Nexius Labs and Master Trainer at Nexius Academy. He has trained business teams and non-technical professionals to design practical AI workflows for sales, operations, and customer support.
Talk to a Course Advisor